
18.2% of York children lived in relative poverty in 2025, a University of York report finds. Low-income homes in Heworth and Hull Road fared worst.
Almost one in five York children lived in relative poverty after housing costs in 2025. That is 18.2%, according to a new University of York report published 125 years after Seebohm Rowntree’s study of poverty in the city.
The report is called Poverty and Progress? 125 years on from Rowntree’s study of life in York. It was written by the university’s Cost of Living Research Group with community researchers from Lived Insights and the Rowntree Society (University of York, 5 October 2026). It was launched on Monday at the Priory Centre (full report, PDF).
Its central finding is a city of two halves. The Centre for Cities has called York the UK’s “most affluent city”, because more of its neighbourhoods sit in the country’s least deprived 20% than in any other major city. Yet the report says thousands of residents are struggling to make ends meet.
The figures in the report
- 18.2% of children in the City of York council area lived in relative poverty after housing costs in 2025. The UK average is 26%.
- 2.2% to 19.8%: the range in child poverty rates between York’s wards.
- 51%: the fall in York’s social housing stock between 1980 and 2025, from 14,952 homes to 7,470. The report links this to Right to Buy sales that were never replaced.
- £311,000: the average York house price in 2026, with a median house price to earnings ratio of 8.5.
- 16th: York’s rank for least affordable housing out of 63 major UK cities. The report says it is the least affordable major city in the north of England.
- £180 a week: the gap between median pay and pay at the 25th percentile, wider than the regional and national gap.
Low-income York households fared worse than London’s
The report uses RAPID, a dashboard built by Policy in Practice and the Joseph Rowntree Foundation from council benefit data. It covers only low-income households known to those records, not the whole population. City of York Council was one of its early users.
On that data, low-income households in York in 2024/25 were more likely to be in poverty than similar households in the 19 London boroughs RAPID covers:
| Measure, 2024/25 | York | London |
|---|---|---|
| Below the relative poverty line | 31.5% | 28.3% |
| Below the minimum income standard | 61.7% | 57.7% |
The minimum income standard is the Joseph Rowntree Foundation’s measure of what the public agrees is needed for an acceptable standard of living.
Which wards fared worst
The likelihood of a low-income household falling below the poverty line varied widely by ward in March 2025. It was highest in Heworth (37.8%), Hull Road (37.0%) and Holgate (35.8%). It was lowest of the wards named in Bishopthorpe (20.2%) and Huntington and New Earswick (20.7%).
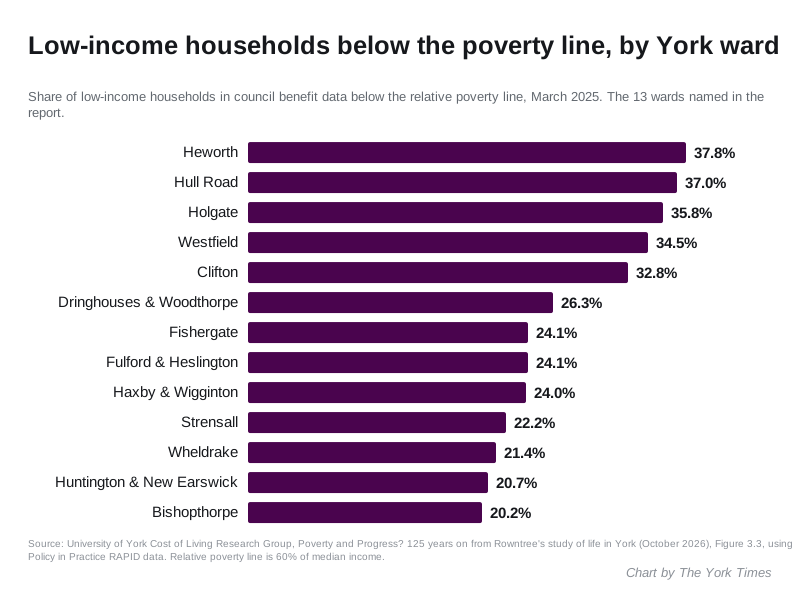
These are rates, not head counts. The report gives an example. Westfield had almost three times as many households below the line as Hull Road, 408 against 142, even though Hull Road’s rate was higher.
Energy bills reach working households
The report’s fuel poverty chapter uses a “fuel stress” measure: spending more than 10% of household income on energy. On that measure, 43% of households in Yorkshire and the Humber were in fuel stress in 2023, against a national average of 35.5%. Nationally the rate was 17.4% in 2019.
The authors say this now reaches people in full-time work, and that renters are suffering most.
What young people and residents told the researchers
Young people described York as “safe”, “historic”, “beautiful” and “comfortable”. Many also described hardship from the cost of living, insecure work and a lack of affordable housing. They said the city increasingly caters to tourists rather than residents, with few affordable spaces for young people.
Community researchers described people feeling “trapped” by poverty. Shame deterred some from seeking help.
Dr Kit Colliver, one of the authors, said: “While York is widely celebrated as the most affluent city in the North, the findings demonstrate that thousands of local families are quietly struggling against soaring housing and energy costs, fragmented support services, and a tourist-centric city centre that leaves many low-income residents feeling isolated and priced out of civic life.”
What the report says is working
It is not all bleak. The report points to:
- Pension Credit: the council used benefit data to find pensioners who were eligible but not claiming. In the first year, 246 of the 430 people contacted went on to claim.
- Free school meals: auto-enrolment and universal free school meals, with the FixOurFood programme, increased funding and reduced stigma.
- Community wealth building: York examples include SPARK and YorSpace.
Its main criticism is that support is fragmented and siloed, and stretched by years of austerity. Its recommendations fall under three headings: investment in local services, removing barriers to existing support, and joint working across sectors and tiers of government.
Then and now
Rowntree’s Poverty: A Study of Town Life was published in 1901. He found 9.9% of York households in “primary” poverty, unable to afford basic necessities even though more than half of them had regular work. Adding “secondary” poverty (17.9%) took the total to just short of 30%.
Those figures used a deliberately strict absolute measure. Today’s figures measure relative poverty against a national median, so the two cannot be compared directly. The report says Rowntree, studying York today, would be just as concerned with inequality as with poverty.
What it means for you
- If you are a pensioner on a low income, check whether you can claim Pension Credit. The council’s benefits and money advice page lists where to get help.
- If your child is at a York school and you receive certain benefits, check they are registered for free school meals.
- The full report, with chapters on housing, food and fuel poverty, is free to read on the University of York’s Policy Engine site.
Housing costs are central to the report. Our York house prices page tracks the Land Registry figures each month, and our council tax bands page sets out what each band pays.
Have your say