
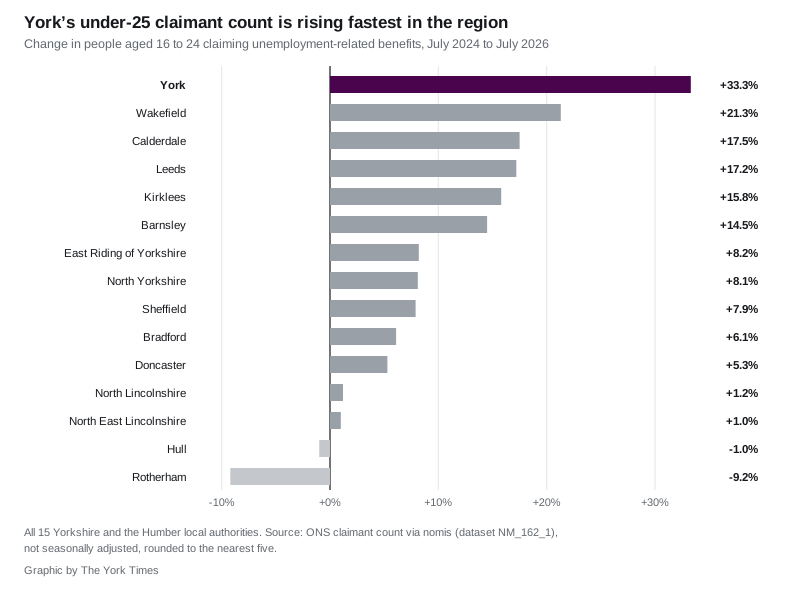
600 York 16 to 24-year-olds were claiming in July, against 450 two years ago. It is the steepest rise of the 15 Yorkshire councils, and the city total barely moved.
The number of 16 to 24-year-olds in York claiming unemployment-related benefits reached 600 in July 2026. Two years earlier it was 450. That is a rise of a third, and it is the steepest of all 15 local authorities in Yorkshire and the Humber.
The figures come from the ONS claimant count published through nomis, the monthly count of people claiming Universal Credit or Jobseeker’s Allowance principally for being out of work.
York’s overall total tells a completely different story. In July 2026 the city had 2,525 claimants of all ages, against 2,555 in July 2024. That is a fall of 1.2%. The rate has sat at 1.8% of residents aged 16 to 64 in each of the last three Julys.
So the headline has not moved for two years. Underneath it, one age group has moved a great deal.
The young line went up while the others went down
Split York’s count by age and the two halves pull in opposite directions.
| Age group | July 2024 | July 2025 | July 2026 | Two-year change |
|---|---|---|---|---|
| 16 to 24 | 450 | 505 | 600 | +33.3% |
| 25 to 49 | 1,515 | 1,465 | 1,395 | -7.9% |
| 50 and over | 585 | 550 | 530 | -9.4% |
| All ages | 2,555 | 2,520 | 2,525 | -1.2% |
The under-25 count rose in each of the last two years, and most of the movement came in the last twelve months. It was up 18.8% on July 2025 alone, again the sharpest year-on-year rise of the 15 authorities.
Set against a longer run, 600 is the highest July figure York has recorded since 2021, when the count was still falling back from the pandemic. Every July from 2015 to 2019 sat between 190 and 330.
York against the region and the country
Under-25 claims are rising nationally, so the direction is not unusual. The size of York’s rise is.
- Across Yorkshire and the Humber, 16 to 24 claims rose from 29,360 to 32,085 over the two years, a rise of 9.3%.
- Across the UK they rose from 287,350 to 332,335, a rise of 15.7%.
- York rose 33.3%, more than three times the regional rate and more than double the UK one.
The next steepest in the region were Wakefield at 21.3%, Calderdale at 17.5% and Leeds at 17.2%. Two authorities recorded falls: Rotherham, down 9.2%, and Hull, down 1.0%.
York’s neighbour, North Yorkshire, rose 8.1%, roughly a quarter of the city’s rate.
Where in York the claims are
Nomis also publishes the count by ward. In July 2026 the 16 to 24 figures were led by:
- Guildhall, 65
- Heworth, 60
- Westfield, 60
- Clifton, 50
- Huntington and New Earswick, 45
At the other end, Bishopthorpe, Copmanthorpe, Heworth Without and Wheldrake each recorded 5.
The ward figures are rounded individually, so they do not add up exactly to the city total. They sum to 605 against the published 600 for under-25s, and to 2,530 against 2,525 for all ages. That is a rounding artefact, not a discrepancy in the data.
What it means for you
If you are reading these numbers about your own household or your own street, three things are worth knowing before you draw conclusions from them.
This is not the unemployment rate. The claimant count measures people claiming a specific benefit. It includes some people who are working but on low enough earnings that Universal Credit imposes work-search conditions on them. The official unemployment rate is a separate survey-based measure and it is not published for a single city each month.
The figures are not seasonally adjusted. July always carries school and college leavers who have finished their courses and not yet started work or further study. That is why every comparison here is July against July rather than July against June. A month-on-month rise in July is normal; a rise on the same month a year earlier is not.
Everything is rounded to the nearest five. A change of five in a ward figure is inside the rounding and should not be read as a trend.
The wider picture in York
The claimant figures land alongside other measures of the city’s economy that point in a more comfortable direction. York house prices rose 4.8% in the year to June 2026, and the city is now the most expensive local authority area in Yorkshire and the Humber, as we reported in our June house price figures.
A city can be getting more expensive and harder for its youngest workers to get into at the same time. On this evidence York is doing both.
The ONS publishes the claimant count every month. The August 2026 figures are the next release.
Sources: ONS claimant count, dataset NM_162_1, via nomis, accessed 23 August 2026. District figures for City of York (E06000014), regional figures for Yorkshire and the Humber (E12000003), UK figures (K02000001), and ward figures from the May 2025 ward geography. All figures are not seasonally adjusted and are rounded by the ONS to the nearest five.
More York information: bin collection days, council tax bands, parking and planning applications.
Have your say