
York homes gained £14,194 in a year, nearly three times England's rate, and the city is now the dearest of the 14 districts in Yorkshire and the Humber.
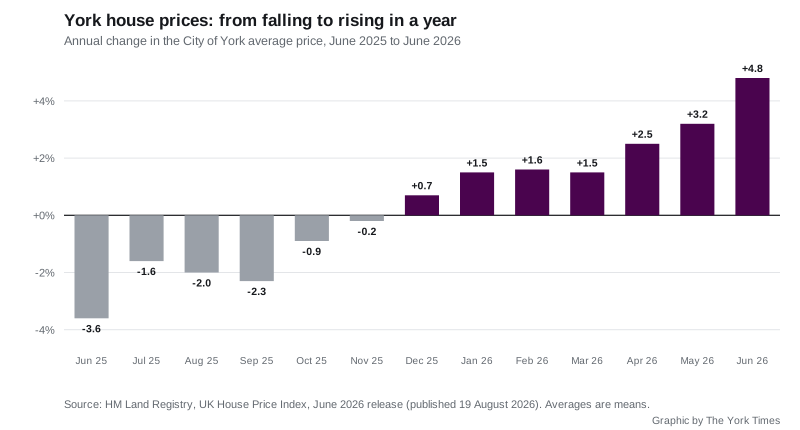
The average York home was worth £309,611 in June 2026, up 4.8% in a year. That is a gain of £14,194 on the same month in 2025, and it is a sharper rise than England managed as a whole. The figures come from HM Land Registry’s UK House Price Index, published at 09:30 on 19 August 2026 and built from completed sales rather than asking prices.
England’s average rose 1.8% over the same year, to £293,262. The UK figure was 2.0%, at £272,188. York is running at nearly three times the English rate.
The turnaround is the striking part. In June 2025, York prices were falling at 3.6% a year. Twelve months on they are rising at 4.8%.
The dearest district in Yorkshire
York is now the most expensive local authority area in Yorkshire and the Humber. The regional average is £207,948, a full £101,663 below the city.
Ranked by average price in June 2026, the region’s districts run:
| District | Average price | Annual change |
|---|---|---|
| York | £309,611 | +4.8% |
| North Yorkshire | £270,569 | +3.1% |
| Leeds | £249,394 | +5.9% |
| East Riding of Yorkshire | £220,721 | +3.7% |
| Sheffield | £219,539 | +5.0% |
| Kirklees | £205,773 | +5.4% |
| Wakefield | £198,519 | +4.8% |
| Calderdale | £191,540 | +9.4% |
| Rotherham | £190,069 | +2.4% |
| Bradford | £185,028 | +6.0% |
| North Lincolnshire | £181,725 | +7.8% |
| Barnsley | £175,733 | +6.0% |
| Doncaster | £170,784 | +4.4% |
| North East Lincolnshire | £151,132 | +7.1% |
Against the country as a whole, though, York’s growth is respectable rather than remarkable. Of the 295 English local authority districts in the June release, York ranks 80th for annual change. Sixty-two districts recorded a fall. The steepest rise was Northumberland at 12.6%; the steepest fall was the City of Westminster at 25.4%.
Semis and terraces are pulling ahead
The gains are not spread evenly across property types. Semi-detached and terraced homes, the stock most first-time buyers and second-steppers compete for, rose fastest. Flats barely moved.
- Detached: £508,572, up 4.0%, a gain of £19,351
- Semi-detached: £331,938, up 5.7%, a gain of £17,822
- Terraced: £287,726, up 5.6%, a gain of £15,333
- Flats: £180,490, up 2.6%, a gain of £4,640
The first-time buyer average, which the index calculates separately, reached £265,563 in June. That is up 5.2% on the year, or £13,043.
How to read the number
The UKHPI average is a mean, not a median. A handful of large sales inside the walls pulls it upwards, so it sits above what a typical York buyer pays. It is best used to track direction over time rather than as a valuation of any particular street.
Two other cautions apply to this release.
First, the index is revised. The May 2026 average was published on 31 July as £308,786; in the June file it has been restated as £308,365. Monthly movements of a few hundred pounds should not be read as news.
Second, sales volumes lag the price data by about three months, so the latest publishable count for York is April 2026, when 137 homes changed hands. The year-earlier comparison is distorted and should not be used at face value: York recorded 450 sales in March 2025 and 96 in April 2025, either side of the 1 April 2025 stamp duty threshold change, against 158 and 137 in the same months of 2026. Buyers rushed to complete before the deadline, emptying the following month.
What it means for you
If you are selling. The direction is with you, and semis and terraces are the strongest part of the York market. The mean average is not your valuation, though. Check what has actually sold on your street using the Land Registry’s price paid search, which lists individual completed sales by postcode.
If you are buying. A first-time buyer paying the York average of £265,563 is now £13,043 worse off than a year ago. Looking outside the city still saves money: North Yorkshire averages £39,042 less and Leeds £60,217 less, though commuting costs and council tax rates differ. The North Yorkshire gap is widening, because the county is rising at 3.1% against York’s 4.8%.
If you already own. The valuation change does not alter your council tax. Bands are still set on values as at 1 April 1991, not today’s prices. Our York council tax bands page sets out the current charges, including the 31 parished areas that pay more than the unparished city.
If you want the longer view. Our York house prices page tracks the city average by property type over time, and our planning news page follows the applications and allocations that shape supply.
Sources
- HM Land Registry, UK House Price Index, City of York, June 2026 release, published 09:30 on 19 August 2026
- HM Land Registry, UK HPI full file, June 2026, used for the regional and national comparisons and the 295-district ranking
- HM Land Registry, Price Paid Data search
UK House Price Index data is Crown copyright, published under the Open Government Licence v3.0.
Have your say