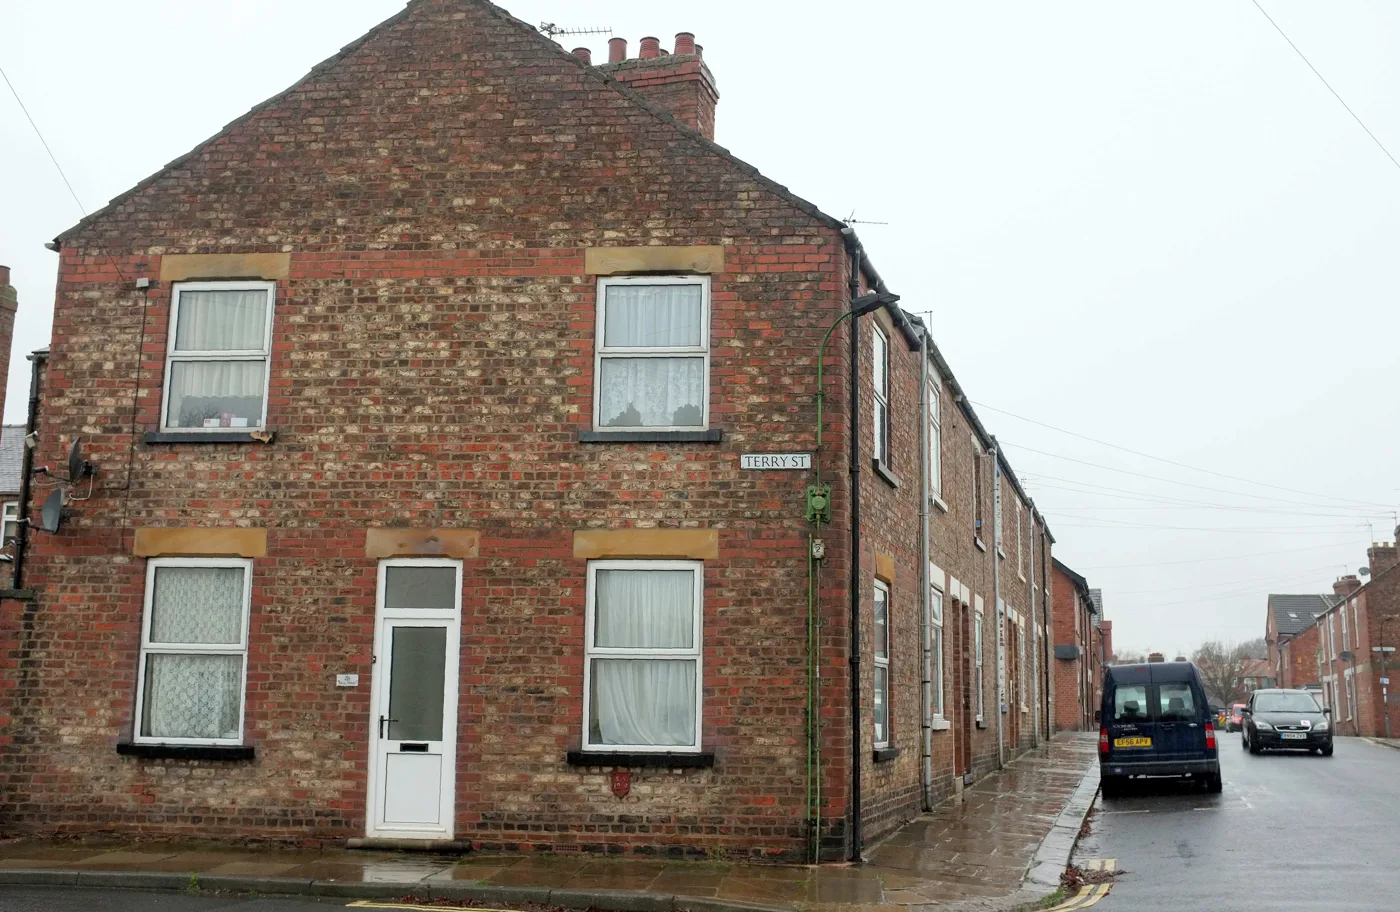

The average York home fell £3,167 in a month to £308,681. It was the only one of the 15 council areas in Yorkshire and the Humber to fall on the year.
The average York home was worth £308,681 in September 2026. That is £707 less than a year earlier, a fall of 0.2%. It is the city’s first year-on-year fall since December 2025.
The drop came in a single month. August’s average was £311,848, the highest York had recorded for almost two years. September came in £3,167 lower, a fall of 1.0%.
The figures are from the September release of HM Land Registry’s UK House Price Index, published on 18 November. The full data file covers every council area in the UK. The index is a mean average of completed sales, not a median and not asking prices.
The only falling market in Yorkshire
Prices rose over the year in 14 of the 15 council areas in Yorkshire and the Humber. York was the exception.
| Area | Average, September 2026 | Change on a year |
|---|---|---|
| York | £308,681 | -0.2% |
| North Yorkshire | £272,191 | +1.1% |
| Leeds | £249,295 | +2.7% |
| East Riding of Yorkshire | £224,424 | +3.1% |
| Kirklees | £214,579 | +7.4% |
| Yorkshire and the Humber | £210,799 | +2.9% |
| England | £292,998 | +0.8% |
Kirklees grew fastest in the region. Across England, York ranked 197th of 295 council areas for annual growth, and 108 of them saw prices fall.
York is still the most expensive place to buy in the region by a distance. The average home costs £36,490 more than in North Yorkshire and £15,683 more than the England average.
What each type of home is worth
September 2026 averages for the City of York, with the change on September 2025:
| Type | Average | Change on a year |
|---|---|---|
| Detached | £507,702 | -0.3% |
| Semi-detached | £331,447 | +0.6% |
| Terraced | £286,988 | +0.1% |
| Flat or maisonette | £178,665 | -2.6% |
| First-time buyer | £264,554 | -0.1% |
| Home mover | £360,402 | -0.3% |
Flats are again the weakest part of the market. The average York flat lost 2.6% in a year, the biggest fall of any property type.
Still below the 2024 peak
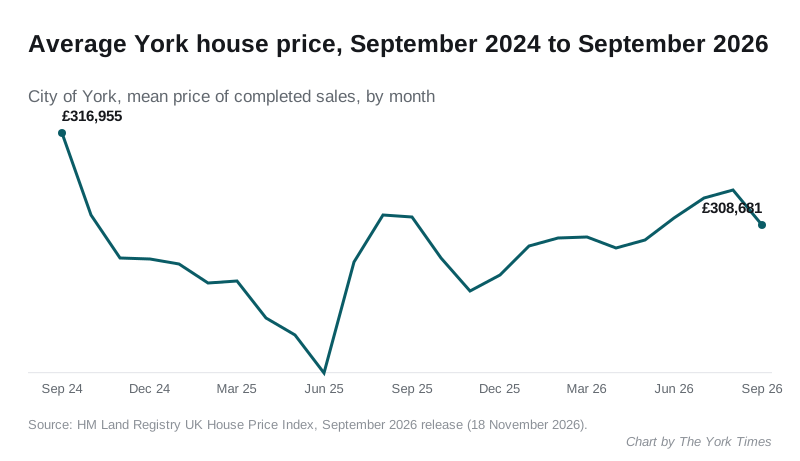
York’s record is £316,955, set in September 2024. Two years on, the average home is worth £8,274 less. The low point since then was £295,417 in June 2025.
The index is rebased so that January 2023 reads 100. York’s September reading is 100.4. In other words, the average York home is worth almost exactly what it was worth at the start of 2023.
Recent months will change
The newest months are built from fewer sales, because many completions are registered with the Land Registry weeks after they happen. Each release revises the months before it.
When we reported the July 2026 figures we gave York’s average as £310,781. The September release revises July up to £311,101. September’s figure may move in the same way next month.
What it means for you
- If you are buying, the year has given you a small amount of room. The average first-time buyer price, £264,554, is a little lower than a year ago.
- If you are selling a flat, expect the toughest comparison. Flats are the only type of York home down by more than 1% on the year.
- If you are watching values, one month is not a trend. York has fallen in a single month before and recovered within the year, as it did in 2025.
Have your say