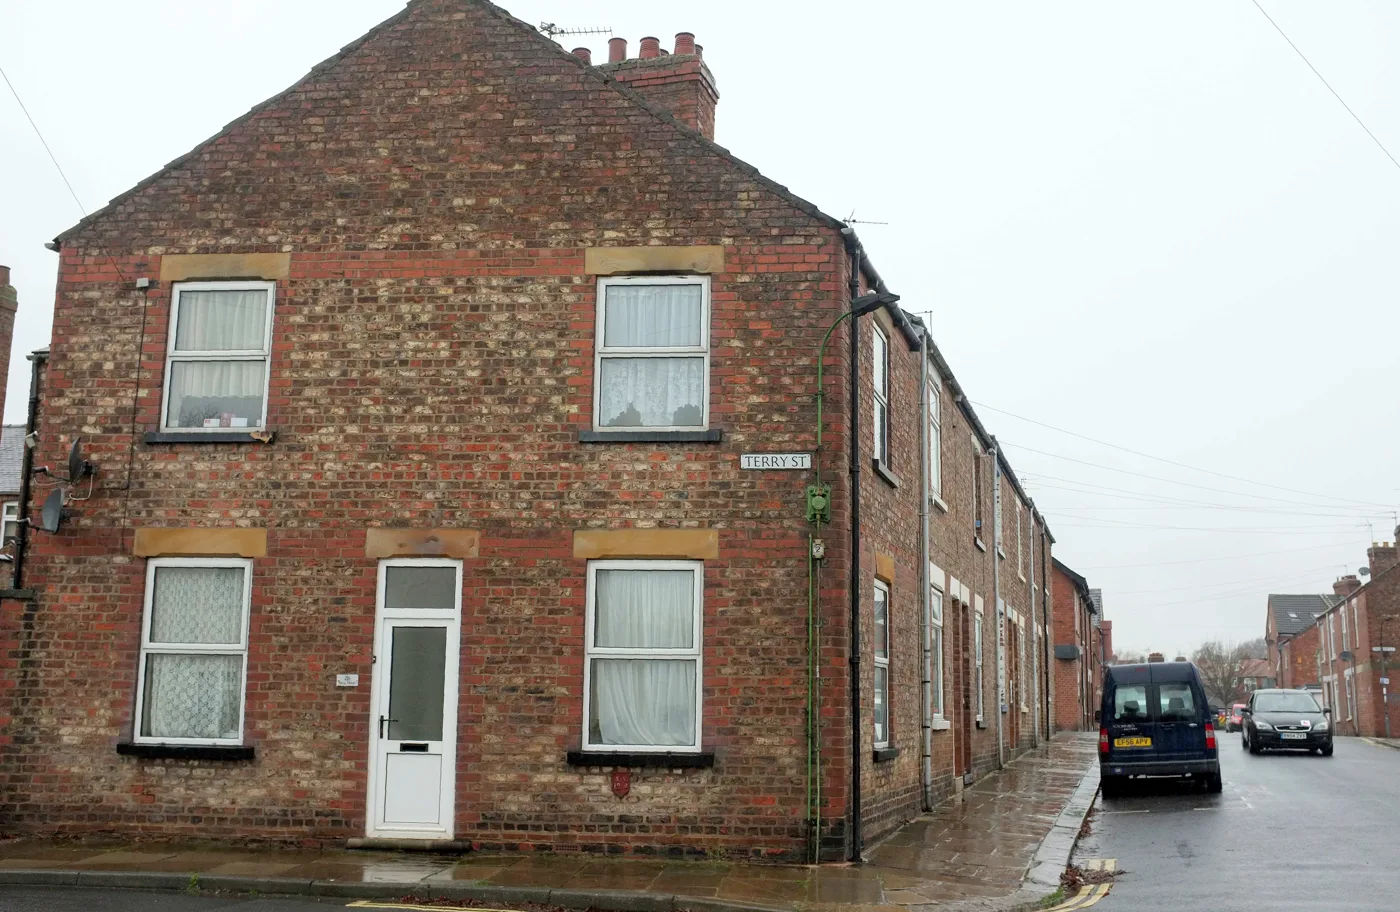

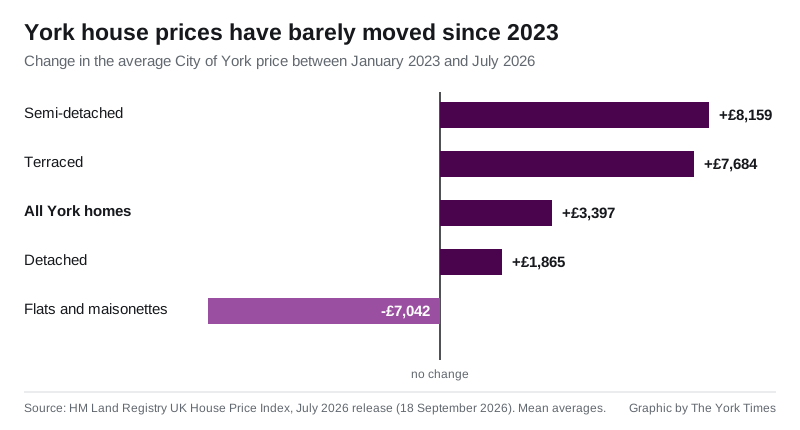
York's average home gained £5,394 in a year to £310,781. Measured from January 2023 the gain is £3,397, and flats are worth £7,042 less than they were then.
The average York home was worth £310,781 in July 2026. That is £5,394 more than a year earlier, a rise of 1.8%. It is also £77 less than the same average in August 2022, four years ago.
The figures come from HM Land Registry’s UK House Price Index, published on 18 September 2026. The index is rebased so that January 2023 reads 100. York’s July reading is 101.1.
In plain terms, the average York home has gained £3,397 in three and a half years. That is a rise of 1.1% over a period in which the cost of almost everything else went up considerably more.
What each type of home is worth
July 2026 averages for City of York, with the change on July 2025:
| Type | Average | Annual change |
|---|---|---|
| Detached | £510,684 | +1.6% |
| Semi-detached | £333,732 | +2.8% |
| Terraced | £289,207 | +2.4% |
| Flat or maisonette | £179,808 | -1.3% |
| First-time buyer | £266,512 | +1.9% |
Flats are the outlier, and they have been for a while. The average York flat is worth £179,808. That is £7,042 less than in January 2023, a fall of 3.8%. Every other type of home in the city is worth more than it was then, if only just: the average detached house has gained £1,865 in the same three and a half years.
Why the annual figure fell so far in one month
A month ago York’s annual rate looked healthy. The June release put the city up 4.6% on the year. July’s release puts it up 1.8%. Prices did not drop. The comparison did.
June 2025 averaged £295,417 in York. July 2025 averaged £305,387. The city added £9,970 in a single month last summer, and August 2025 went higher still at £309,613. Those months are now the base that this year’s figures are measured against, so the annual percentage falls even while prices tick up.
The month-on-month change tells the steadier story. July was 0.6% up on June.
A note on our June figure
When we reported the June 2026 data on 20 August we gave York’s average as £309,611, up 4.8%. The July release revises June down to £309,023, up 4.6%. Revisions of this kind are routine. The index is built from completed sales registered with HM Land Registry, and late registrations change recent months for several releases after they first appear.
York against the rest of Yorkshire
York remains the most expensive of the 15 local authority areas in Yorkshire and the Humber. It is also one of the slowest growing.
- York £310,781, up 1.8%
- North Yorkshire £270,463, up 2.5%
- Leeds £247,695, up 3.8%
- East Riding of Yorkshire £220,408, up 1.6%
- Yorkshire and the Humber as a whole £209,116, up 3.0%
- Kingston upon Hull £135,511, up 5.9%
A York home costs £40,318 more than the North Yorkshire average and £101,665 more than the regional average. England as a whole averaged £293,479 in July, up 1.1%, so York carries a £17,302 premium over the country.
On growth, York ranks 13th of the 15 areas. Only Rotherham at 1.7% and the East Riding at 1.6% rose more slowly. North East Lincolnshire led the region at 6.9%.
What it means for you
If you are selling. The city’s headline average is £6,174 below September 2024’s £316,955, the highest monthly figure the index has recorded for York in the past five years. A 2024 valuation is not a 2026 valuation.
If you own a flat. Flats are the only York property type worth less than a year ago, and less than in January 2023. If you bought a flat in the city in the last four years, check the index for your own type before assuming equity has built up.
If you are buying your first home. The first-time buyer average in York is £266,512, up 1.9% on the year. At that price a first-time buyer pays no stamp duty, because first-time buyer relief runs to £300,000. A buyer who is not a first-time buyer pays 2% on everything above £125,000, which at £266,512 comes to about £2,830.
If you are comparing bills. The price you pay has no bearing on your council tax band, which is still based on what a property was worth on 1 April 1991. Our York council tax bands page sets out the 2026/27 charges, including the 31 parish areas that pay more than the unparished city.
How to read the index
UKHPI is a mean average, not a median, so a small number of large sales pulls the figure up. It covers completed sales, so July’s figure mostly reflects offers accepted earlier in the year. It is published for the whole City of York local authority, which stretches from Haxby and Strensall to Bishopthorpe, Copmanthorpe and Wheldrake, so neighbourhood prices vary a long way either side of it.
Our York house prices page tracks the figure each month.
Sources
Have your say